Surprising Judge-to-Judge Variations
Documented In Federal Sentencing
An analysis of more than 370,000 cases completed in the nation's federal courts during the last five years has documented extensive and hard-to-explain differences in the sentencing practices by the judges working in many federal districts. This first-of-its-kind, judge-by-judge review by the Transactional Records Access Clearinghouse (TRAC) of federal sentences imposed for drugs, white collar and other kinds of crimes from FY 2007 to FY 2011 indicates that the typical sentence handed down by a federal district court judge can be very different than the typical sentences handed down for similar cases by other judges in that same district. This finding raises questions about the extent to which federal sentences are influenced by the particular judge who was assigned to decide it rather than just the specific facts and circumstances of that case.
Caution. A key requirement for achieving justice is that the judges in a court system have sufficient discretion to consider the totality of circumstances in deciding that a sentence in a specific case is "just." No set of rules, including the federal sentencing guidelines, can substitute for this necessary flexibility. But a fair court system also requires "equal justice" under the law. This means that the average or typical sentences of the judges will not be widely different for similar kinds of cases. So the goal of systematically examining sentences is not to develop a lockstep sentencing system. Rather, the goal is to provide both the courts and the public with accurate information so that they can examine whether justice is being achieved. Judge-to-Judge Variation in Sentencing: Some Illustrative Districts
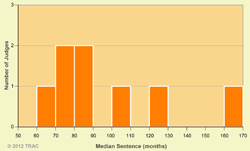
The extensive TRAC analysis summarized in this report is based on hundreds of thousands of records obtained under the Freedom of Information Act as a result of a series of lawsuits against the Justice Department. This has been combined with information obtained directly from the federal courts. See About the Data. Together, these data indicate that long-term efforts to improve the consistency of the federal sentences through the adoption of complex sentencing guidelines have not been entirely successful in curtailing large judge-to-judge differences in sentencing practices. Here are a few examples involving drug convictions:
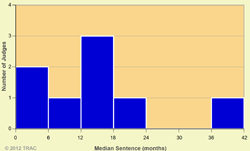
At the low end of this small group of federal judges, the median sentence was 60 months. At the other extreme, however was another judge whose median sentence was 160 months. Nor did the sentences of the remaining six judges cluster together. In fact their typical sentences were also quite varied. Assuming the drug cases handled by these eight judges were assigned on an approximately random basis, this variation is hard to explain.
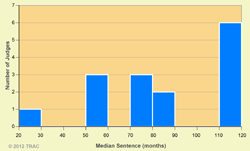
Part of these differences might be accounted for by differences in the composition of cases assigned judges located in different offices within the district. Alexandria judges had median sentences which ranged from a low of 30 months to a high of 87 months, while Norfolk judges ranged from 79.5 months to 120 months. Thus, even within each office, the range in median sentences was still large.
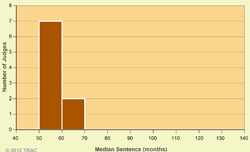
While large district-to-district differences were not uncommon, there were other districts where there was relatively strong agreement in the sentencing practices of the judges.
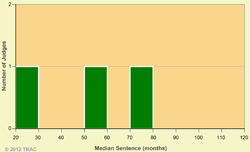
Districts with two or three judges often showed more agreement. However, this wasn't always the case.
Similar patterns of differences in judge-to-judge median sentences were observed in other types of cases, including for white collar crimes.
Examining Judge-to-Judge Differences Across all Federal Districts The basis for TRAC's unique analysis was the case-by-case records that included each sentence imposed by federal district judges on defendants convicted of a federal crime during the past five years, FY 2007 - FY 2011. Excluded were cases handled by magistrate judges or special judges sitting by designation. To ensure that we only looked at judges who had sentenced a sufficient volume of individuals to make comparisons meaningful, we excluded judges that during this period had not sentenced at least 50 defendants. This left us with sentencing records on 885 district judges who had sentenced a total of 372,232 defendants over the past five years. The average number of defendants each had sentenced was 420.  As we noted above, some districts courts showed close correspondence in the average and median sentences their judges had handed down for similar types of offenses. Other districts showed wide differences in judge-to-judge sentencing patterns. To calculate a district's difference we ordered judges by their median sentences (highest to lowest) for that type of case, and then calculated the differences in months in the median sentence assigned between the highest and lowest judge. Sentences for Drug Cases. Table 1 shows the districts with the largest judge-to-judge differences in median drug sentences and those with the least.[1] The three districts with the largest differences were the Northern District of Texas with a difference of 100 months between the median sentence of the judges with the highest and lowest median drug sentence, followed by the Northern District of Georgia, and the Eastern District of Virginia tied at 90 months each. The judge-by-judge details for Texas North and Virginia East were discussed in the previous section. Table 1. Drug Offenses — Districts by Their Difference in Median Sentences of Judges FY 2007 - FY 2011
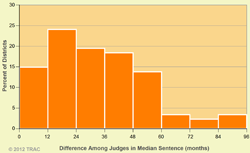
If drug cases were assigned to judges in a roughly random fashion, then the general mix of cases considered by each judge in a specific court should be roughly similar. Because each of these judges had determined a large number of sentences in their districts, the median or typical sentence assigned on various groups of cases should have been roughly similar for each. Or put another way: to the extent judges' median drug sentences depart from one another within the same district, these differences cannot be explained on the basis of the worthiness of the cases handled by individual judges. One or more other factors — such as the pre-existing predilections of the judge assigned — must be the source for these disparities. If cases in fact were not randomly assigned, then other "equal justice" questions arise about the basis for this selectivity. For example, is the mix of the seriousness of cases different in cases handled by different court offices within a district? If so, why does this occur? At the other end of the continuum are the bottom ten districts (actually 13 districts because of ties) where the difference was 12 or fewer months. The district with the closest agreement among judges in their median drug sentences was Rhode Island. Its two judges had exactly the same median drug sentences. This was followed closely by the Central District of Illinois whose four judges had almost the same median sentences — within 0.5 months on one another. The Western District of Kentucky with five judges and Vermont with two judges were tied with median sentences within each district within 3 months of one another. While there was a tendency for smaller courts to show closer agreement, eight of the "top ten" districts had fewer judges than one of the districts — the Southern District of California with thirteen judges — in the "bottom ten" list where judges were in close agreement. Figure 6 displays these district-by-district differences graphically. As the chart shows, in 15 percent of the districts, judge-to-judge differences in median drug sentences were relatively small — within 12 months. In just under 40 percent it was under 24 months. At the other end, however, in over 40 percent of the districts the typical sentences among judges differed by more than 36 months. In nearly one out of four districts the difference was more than 48 months. Five districts had a difference of 60 months, and in an additional eight districts the difference was more than 60 months. Sentences for White Collar Cases. The discussion above about the considerable district-by-district differences that have shown up for drug prosecutions also applies to the sentencing of white collar crimes. For white collar offenses, the differences in judge-to-judge sentencing months within a district were smaller in magnitude. However, these differences in relative terms were in fact larger because the typical white collar sentence of 11.5 months was only about one-fifth the length of the median drug sentence of 60 months. Table 2 shows the districts with the largest judge-to-judge differences in median sentences for white collar offenses and those with the least.[2] The three districts with the largest differences were the Northern District of Illinois with a difference of 39 months between the median sentence of the judges with the highest and lowest median white collar sentence, followed by Maryland with a difference of 27 months. The Northern District of Georgia was in third place with a 25 month differential. The judge-by-judge details for the Northern District of Illinois was discussed in the previous section. Table 2. White Collar Offenses — Districts by Their Difference in Median Sentences of Judges FY 2007 - FY 2011
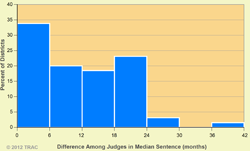
Five districts on the top ten list for white collar crimes also made the list for having the highest judge-to-judge differences for drug sentences. At the other end of the continuum are the bottom ten districts where the difference was 3 or fewer months. The districts with the closest agreement among judges in their median white collar sentences were the Southern District of Iowa and Puerto Rico where judges in each district had identical median sentences. Figure 7 shows the distribution of all districts on their difference scores for white collar median sentences. As seen in the graph, for about one third of the districts judge-to-judge differences in median white collar sentences were small — within 6 months. However, in over a quarter of the districts the difference between the median sentence assigned by each judge varied by over 18 months. And in five percent of the districts the difference was over 24 months. Conclusion For all large government institutions, expanding the availability of carefully documented information about their operation is essential to improving the fairness and effectiveness of their functioning. With this thought in mind TRAC has collected hundreds of thousands of required records, analyzed them in a new way and developed a sophisticated online system so that judges, law schools, scholars, public interest groups, Congress and others can easily access them and be better informed about the best ways to achieve the broad goal of improving the federal courts. [1] To help ensure a sufficient number of cases for meaningful comparison, only 672 judges who had sentenced at least 40 drug cases during this period were compared. They sentenced a total of 103,750 defendants, with an average of 154 sentences each. In two federal district courts, Delaware and the Eastern District of Oklahoma, only one judge had sentenced at least 40 drug defendants so these two districts were excluded from this comparison. There are a total of 94 district courts covering the United States and its territories. [2] To help ensure a sufficient number of cases for meaningful comparison, only 338 judges who had sentenced at least 40 white collar cases during this period were compared. They sentenced a total of 21,149 defendants, with an average of 62 sentences each. A total of 65 districts had at least two judges who met this criteria and were therefore included in these comparisons. There are a total of 94 district courts covering the United States and its territories. | |||||||||||||||||||||||||||||||||||||||||||||||||||||||||||||||||||||||||||||||||||||||||||||||||||||||||||||||||||||||||||||||||||||||||||||||||||||||||||||||||||||||||||||||||||||||||||||||||||||||||||||||||||||||||||||||||||||||||||||||||||||||||||||||||||||||||||||||||||||||||||||||||||||||||||||||||||||||||||||||||||||||||||||||||||||||||||||||||||||||||||||||||||||||||||||||||||||||||||||||||||||||||||||||||||||||||||||||||||||||||||||
No comments:
Post a Comment